Skip to Main Content

Hot Topics: The Second Amendment and Gun Control

Bureau of Justice Statistics

Mass Shootings in America

The Violence Project

Centers for Disease Control and Prevention

Gun Violence Archive

Quick Look: 277 Active Shooter Incidents in the United States From 2000 to 2018

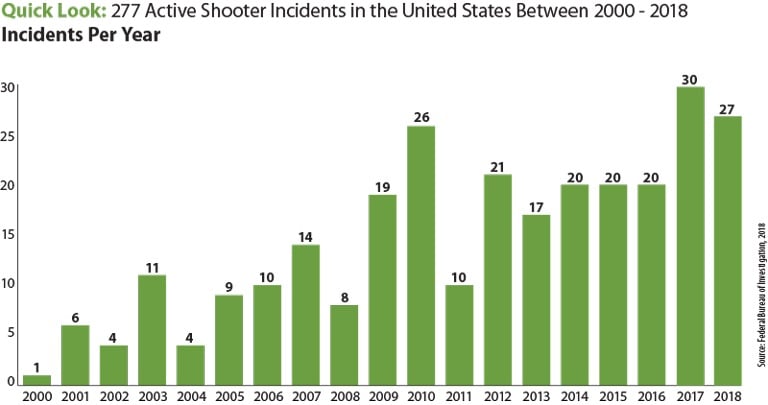
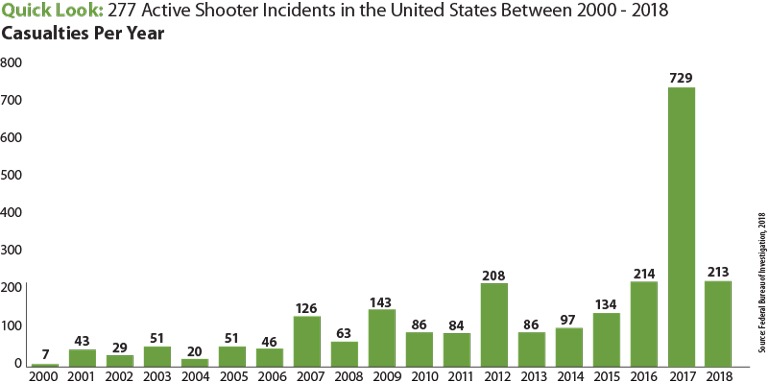
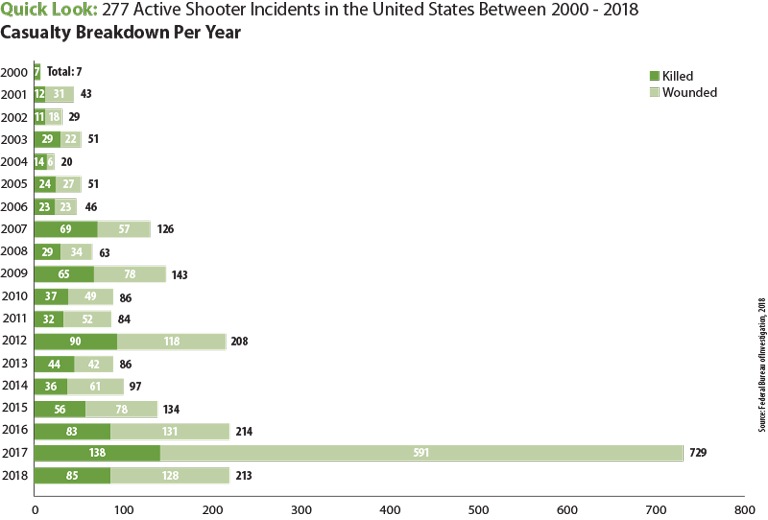
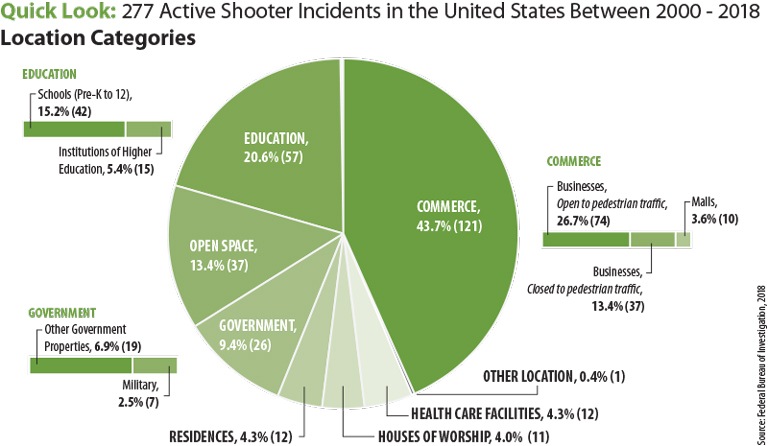
The five downloadable graphics below reflect statistical information pertaining to the 277 FBI-designated active shooter incidents that occurred in the United States from 2000 to 2018. These graphics depict the total number of incidents per year, total casualties per year, individuals killed and wounded per year, and incident locations. Click on each graphic for a higher resolution version.

The above bar chart contains the numbers of active shooter incidents in the United States, broken down by year, from 2000 to 2018. Those yearly numbers are: 2000, one incident; 2001, six incidents; 2002, four incidents; 2003, 11 incidents; 2004, four incidents; 2005, nine incidents; 2006, 10 incidents; 2007, 14 incidents; 2008, eight incidents; 2009, 19 incidents; 2010, 26 incidents; 2011, 10 incidents; 2012, 21 incidents; 2013, 17 incidents; 2014, 20 incidents; 2015, 20 incidents; 2016, 20 incidents; 2017, 30 incidents, and 2018, 27 incidents. The total number of active shooter incidents during the time frame was 277.

The above bar chart contains statistics, broken down by year, of the number of casualties that resulted from active shooter incidents from 2000 to 2018. Those yearly numbers are: 2000, seven; 2001, 43; 2002, 29; 2003, 51; 2004, 20; 2005, 51; 2006, 46; 2007, 126; 2008, 63; 2009, 143; 2010, 86; 2011, 84; 2012, 208; 2013, 86; 2014, 97; 2015, 134; 2016, 214; 2017, 729; and 2018, 213. The total number of casualties for this time frame was 2,430.

The above stacked bar chart includes statistics on the number of killed or wounded casualties, broken down by year, after active shooting incidents in the United States between 2000 and 2018. Those numbers are: 2000, seven killed; 2001, 12 killed and 31 wounded; 2002, 11 killed and 18 wounded; 2003, 29 killed and 22 wounded; 2004, 14 killed and six wounded; 2005, 24 killed and 27 wounded; 2006, 23 killed and 23 wounded; 2007, 69 killed and 57 wounded; 2008, 29 killed and 34 wounded; 2009, 65 killed and 78 wounded; 2010, 37 killed and 49 wounded; 2011, 32 killed and 52 wounded; 2012, 90 killed and 118 wounded; 2013, 44 killed and 42 wounded; 2014, 36 killed and 61 wounded; 2015, 56 killed and 78 wounded; 2016, 83 killed and 129 wounded; 2017, 138 killed and 591 wounded; and 2018, 85 killed and 128 wounded. During the time frame, the total number killed was 884 and the total number wounded was 1,546.

The above pie chart shows a statistical breakdown of the location categories where the 277 active shooter incidents took place in the U.S. from 2000 to 2018. Those location categories include: areas of commerce, 121 incidents or 43.7 percent; educational environments, 57 incidents or 20.6 percent; government property, 26 incidents or 9.4 percent; open spaces, 37 incidents or 13.4 percent; residences, 12 incidents or 4.3 percent; houses of worship, 11 incidents or 4 percent; health care facilities, 12 incidents or 4.3 percent; and other location, 1 incident, or 0.4 percent.